Performance Metrics: To Measure is to Know
May 2014

Background of a Metric
What is a “metric”? A metric is a “standard of measurement,” with a measurement being a set of observations that reduce uncertainty where the result is expressed as a quantity.
Why metrics? In general, what gets measured gets fixed.
An organization that wants to be well informed of its performance as well as be proactive in process improvement should develop, implement, and maintain a metrics program. The primary goal of a metrics program is to provide management with a basis for factual decision-making, one of the eight ISO 9000 quality management principles. Applying the principle of factual approach to decision-making typically leads to:
- Ensuring that data and information are sufficiently accurate and reliable
- Making data accessible to those who need it
- Analyzing data and information using valid methods
- Making decisions and taking action based on factual analysis, balanced with experience and intuition1
Furthermore, properly developed metrics offer: a balanced picture of performance; tools to convert strategy to action; a means to manage factors that drive success; and a way to grow the value of an organization.
Cautionary Tales of Using Metrics
Do not focus on managing people through metrics. It may improve performance in the short term, but over time may actually discourage desired behaviors and often result in employees either leaving the organization or remaining and manipulating the system.
Other cautions to be aware of are:
- Too many metrics—no one person should oversee more than a few metrics
- Tracking useless metrics
- Not linking the metrics to any critical processes or operations
- Metrics lacking targets/goals
- Lack of clarity and/or too complex formulas
- Accepting vendor metrics without questioning them at all or reviewing any associated data
- Using old data – many times personnel try to push old data into a metric and try to make it fit rather than collecting the data that are really needed
The Anatomy of a Metric
How do you develop a metric? This may sound like an easy question, but many people get stuck in this process. One could measure everything, but the cost would be significant. The best place to start is to focus on the critical success factors of the organization and ask what leads to long-term success. What factors drive the organization’s mission? Strategic goals? Tactical goals? Processes? Operations?
Remember, what gets measured usually gets fixed. It is thus important to know what data and information are needed.
Keep in mind there are different types of metrics, and shown in the following table. Strive for a good mixture of metrics. The most typical metric types used are timeliness and quality.
Different Types of Metrics2
| Metric Type |
Description |
Example |
Risk |
Timeliness |
Focuses on a specific milestone/deliverable being met. |
The # of days between the site planning and actually being activated. |
The risk of only using this metric is one could use excessive resources to complete the task on time and the metric would not show this. |
| Quality |
Focuses on how well a deliverable meets the requirements of the customer’s process. |
Quality of expedited safety reports submitted to the FDA. |
The risk of focusing on the quality metric is missing the timeliness and potentially high cost. |
| Efficiency |
Measures the amount of resources required to complete a project versus the expected amount of resources. |
The difference between the actual final cost for a clinical trial vs. the initial projected cost for the trial. |
The risk of focusing on this metric is using minimal resources and not hitting your deadlines. |
| Cycle Time |
Measures the time to complete a task. |
Audit report issued within 10 days of the onsite visit. |
The risk of focusing on cycle time can result in faster cycle time with poor quality, which can result in longer overall time as processes are repeated. |
| Leading Indicator |
Measures information you can act on immediately to get the process back on track |
Number of sites activated vs. expected = suggests issue with enrollment. |
The risk with this metric is it will not provide data for process improvement. |
| Lagging Indicator |
Measures information you can use for future trials, baseline for process improvement. |
Last subject, last visit. |
The risk in using this data alone is that it does not provide information for the current work, only information to use going forward. |
To help organize the effort:
1. Identify Metric(s)
Write down the critical success factors and then ask what metric would identify its success.
However, what looks good on paper does not necessarily mean it is a good metric. Use the “so what?” test to evaluate each metric. For example, what will the captured data tell you that you did not already know? Would it drive an action? If no action can be taken, it may be a useless metric.
2. Develop a Goal for the Metric
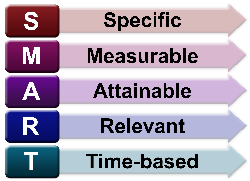
Develop a SMART goal for the metric. A SMART goal is defined by the following criteria:
- Specific – targets a specific area for improvement.
- Measurable – quantifies or at least suggests an indicator of progress.
- Assignable – specifies who will do it.
- Realistic – states what results can realistically be achieved, given available resources.
- Time-related – specifies when the result(s) can be achieved.
|
 |
3. Define and Document What Data and Information is Needed
Will it take a great deal of time and effort to collect the data and information? Is there an accurate and reliable way to collect the data? If the metric is not thought through, the data collected may be useless or the data may not be collected consistently.
4. Define and Document Your Collection Method(s)
Define a specific collection method for the metric. Options may include, but not limited to, using Excel, Access, or other software programs.
How will the data be tracked?
- How will the training be documented?
- Where will the training requirements be captured for each employee?
- What is the frequency of metric review (monthly, quarterly or otherwise)? What if review is missed? How critical will this be?
- If data are missed, how will that be handled?
- Who is responsible for the data/documentation?
Over time, someone else may take over the process, so clearly documenting how data and information will be routinely collected, reported, and maintained is essential.
5. Verify and Validate the Collection Method(s)
Verify and validate by testing the metric to make sure it works along with the data collection process to avoid any problems.
 Verify the following: your database/process is capturing the correct information; the staff understands the metrics and goals; and any calculations within spreadsheets work correctly.
- Validating your data collection method early is better than waiting one year to determine something is wrong with the process and losing a year’s worth of data. It is not a 21 CFR Part 11 validation situation necessarily but rather a best practice.
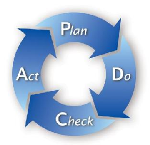
Applying the Plan–Do–Check–Act (PDCA) cycle to verification and validation of the chosen metric with the data it represents allows for continual refinement of the collection process.
6. Perform Maintenance
Evaluate and Reevaluate each goal and metric. This will make the previously-established SMART goals SMARTER.
After implementation:
- Consider the PDCA cycle for your metrics.
- Update metrics as needed with a focus on risk.
- Train new staff on the metrics process.
- Re-evaluate metrics when organizational/project goals are updated.
- Review and update metrics on a routine schedule.
- Make sure new staff are trained on data collection and interpretation of the metrics- as well as the overall purpose (have backups).
- Add and drop metrics where necessary – do not be afraid to let go of an old metric.
Conclusion
In conclusion, use metrics to make effective decisions based on the analysis of accurate and reliable data and information. Keep in mind that metrics are unique. There is no “one size fits all” metric. The development of a metrics program is a process that an organization must take on its own. Focus on the vital few, not the trivial many.3 Develop SMART goals, even better, have a SMARTER metrics program.
Footnotes
1 “Quality Management Principles” ISO, 2012 http://www.iso.org/iso/qmp_2012.pdf
2 Dorricott, K. (2012). Using Metrics to Direct Performance Improvement Efforts in Clinical Trial Management. The Monitor, 26(4), 9-13.
3 Juran, J., Managerial Breakthrough, McGraw Hill, New York, New York, 1995.
Further Reading
- Frost, B. (2007). Designing Metrics: Crafting Balanced Measures for Managing Performance. Measurement International. Dallas, TX.
- Quality Council of Indiana (Eds.) (2007). The Six Sigma Black Belt Primer. (2nd ed), W. Terre Haute, IN.
- Wool, L. (2012). Intertwining Quality Management Systems with Metrics to Improve Trial Quality. The Monitor, 26(4), 29-35.
- Zuckerman, D. (2012). Using Metrics to Make Continuous Progress in R&D Efficiency. The Monitor, 26(4), 23-27.
- Wikipedia, SMART criteria, http://en.wikipedia.org/wiki/SMART_criteria
About the Author
Dr. Susan Leister, (TRI Director of Quality Assurance) has over 15 years of regulatory and quality management experience, including 5 years preclinical and 10 years of clinical experience in the pharmaceutical, biotechnology, and government arena. She holds a Ph.D. in Organizational Management with a focus in Leadership, as well as an MBA and BS in Biochemistry and Molecular Biology. She also has American Society of Quality Certifications for Quality Auditor and Six Sigma Black Belt, and serves on the local American Society of Quality Board as the Certification and Exam Chair.

