Risk-Based Monitoring of Clinical Trial Sites
November 2015

Risk-based monitoring (RBM, also called adaptive monitoring) is a departure from the traditional paradigm of 100% source data verification (SDV) because it places an emphasis on targeting critical trial data and processes. The process is uniquely tailored to each trial, which allows the monitors to focus on metrics that are of particular concern. This approach is especially effective when the process is automated using electronic data capture coupled with monitoring and data visualization software. In the “Guidance for Industry: Oversight of Clinical Investigations—A Risk-Based Approach to Monitoring1” document, the FDA states that “risk-based monitoring could improve sponsor oversight of clinical investigations.” Imagine, for example, you are a clinical trial monitor responsible for several phase III trials. Adhering to traditional 100% SDV would mean reviewing millions of data points, some of which many be irrelevant to the outcome of the trial. Focusing on data points of interest allows you to focus on finding errors that are costly and allocate additional resources to mitigate those errors.
The Scope of RBM
RBM is often executed simultaneously in three contexts: 1) central monitoring, 2) off-site monitoring, and 3) on-site monitoring. Central monitoring emphasizes risk and performance indicators and can best be thought of as a site specific review of centralized data. Common examples of risk indicators that are critical to central monitoring include: protocol deviation rates, data entry metrics, adverse event reporting trends, subject drop-out rates, and error rates in critical data/ processes. Since central montoring focuses on several sites at once, the results of these reviews may lead to interventions or remediations at several clinical trial sites simultaneously. The rationale for off-site monitoring is as follows: in the interest of time and efficiency, everything that can be done remotely should be done remotely . Examples of key metrics for off-site monitoring include: timeliness and quality of data entry, protocol compliance, review of essential documents, recruitment and enrollment, changes in site staff, monitoring of investigational product, and training. Finally, on-site monitoring includes activities that can only be carried out during a site visit, and will usually include: source data review and verification, informed consent review, essential documents review, investigational product accounting, and face to face interactions with site staff. SDV is carried out on critical data only. Some of these activities may not be required at every visit, depending on the outcome of the risk assessment.
TThe Execution of RBM
RBM is typically carried out in three steps: 1) the identification of critical data and processes, 2) execution of a target risk assessment, and 3) development and execution of a monitoring plan. The identification of critical data and processes is the first step. The clinical protocol, in addition to all applicable regulations and standard operating procedures (SOPs) can serve as a guide during this process. For example, the FDA identifies the following aspects as critical for most trials: obtaining informed consent, adherence to protocol eligibility criteria, documentation of test article administration, documentation of study endpoint and safety assessments, and documentation of trial integrity; but these processes may not be identified as critical to every trial, since every trial is unique. It is useful to subset critical data and processes into categories: operational/ logistical data analysis, clinical data analysis, and financial data analysis. The purpose of the second step, targeted risk assessment, is to identify specific sources of risk to critical processes that the monitor may encounter during the trial. The evaluation can be based on the historical performance of the site, medical officer, safety concerns specific to the test article, and the complexities of the clinical trial itself. When considering the strengths and weaknesses of the trial site, it is useful to identify previous issues such as protocol deviations, inadequate record keeping, and over or under reporting of adverse events. The risk assessor should also take into account the geographical location of the trial (whether the location is considered resource poor, suffers from civil unrest, etc.) and the characteristics of the proposed study population. This process will yield the key performance and key risk indicators (KPIs/ KRIs) that will be tracked during monitoring. The last step, development and execution of the monitoring plan requires raw data gathered throughout the trial, access to data analysis and visualization software, and key personnel to aggregate and analyze the data and calculate the KPIs and KRIs. Data reporting and extraction should occur in as close to real time as possible. The advantage of using real time electronic data capture and data visualization software allows for the speedy identification of critical issues during a trial, which in turn allows the monitoring team to alert on site personnel for rapid remediation. Monitors can use RBM and data visualization software to develop customized dashboards that aggregate and organize large quantities of data according to categories. Risk based monitoring should also be adaptive and responsive, so that as new risks are identified during the trial, the monitoring plan is adjusted to include them.
The RBM Dashboard
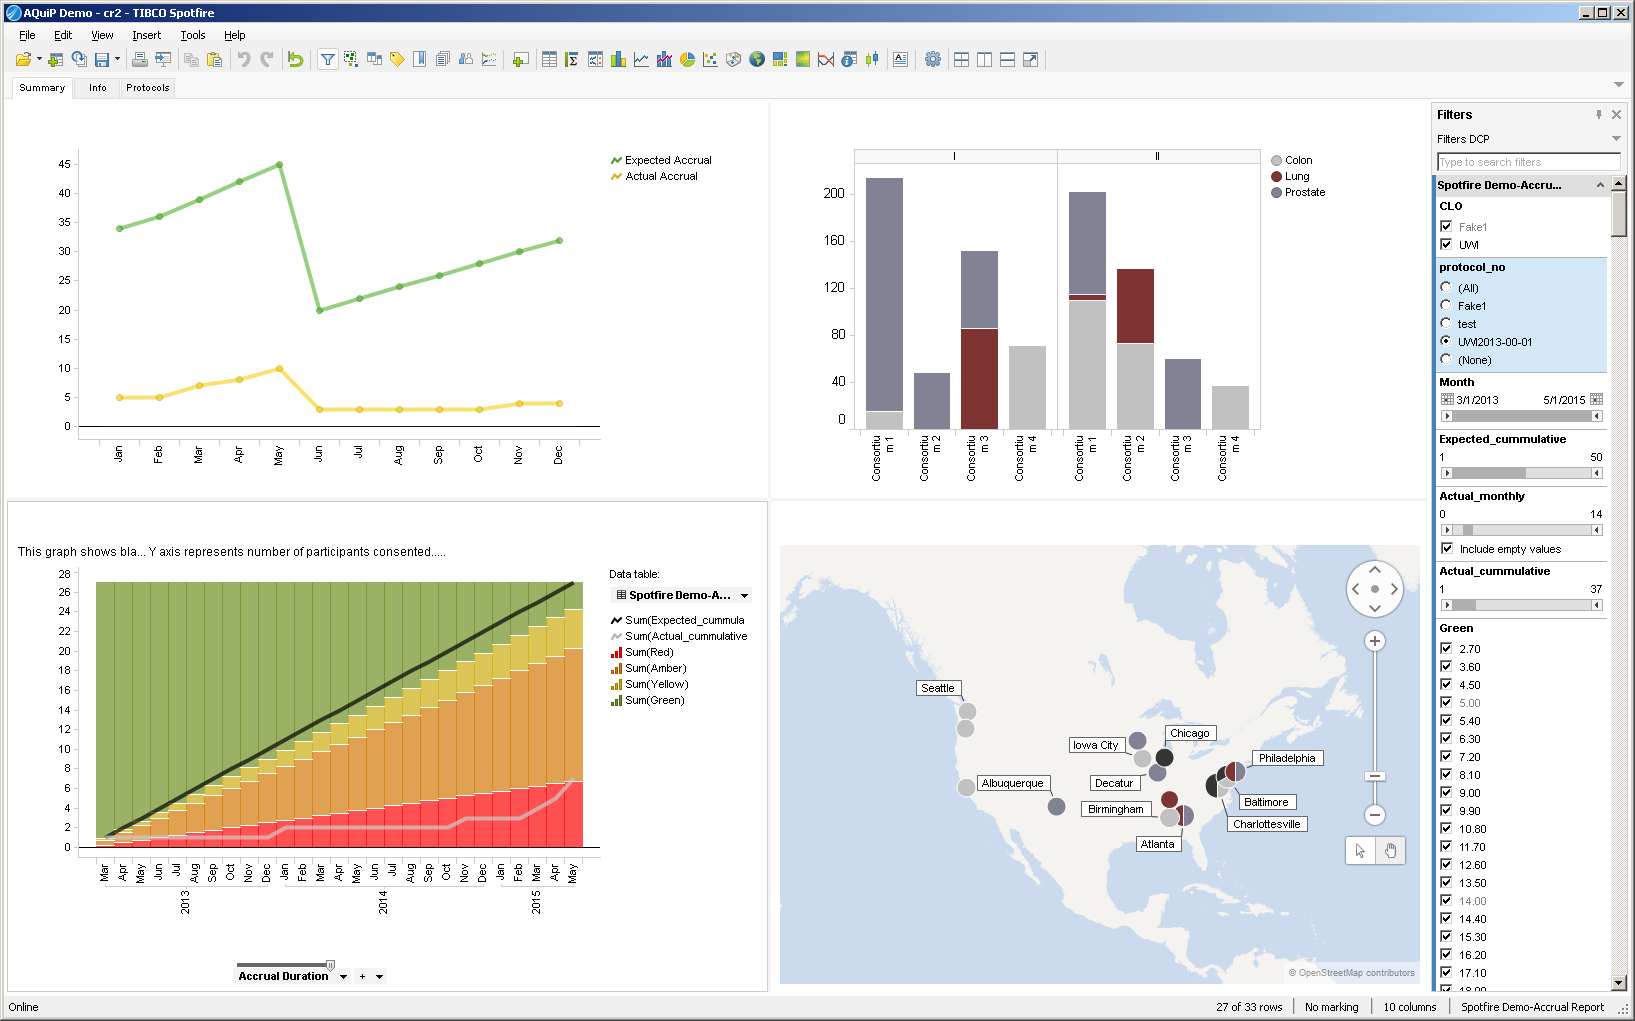
A RBM dashboard may include the metrics described below. Metrics will vary from trial to trial, depending on the outcome of the risk assessment.

- Operational and logistical data analysis focuses on analyzing KPIs such as protocol adherence, eligibility screening, informed consent, patient drop-out rate, resource forecasting, and trial milestones, in addition to data issue identification, query management, data cleaning and data extraction.
- Clinical data analysis could include multivariate visualizations, relationships between variables, and aggregate and patient level safety assessment (such as time to event analysis, spontaneous medical/ adverse events, signal detection, odds ratio, and attributable risk).
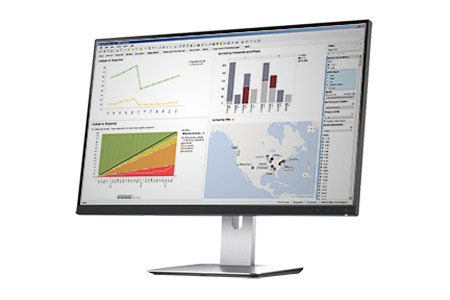
- Data visualization using software with a customized dashboard provides a very useful output for monitoring KPIs and KRIs. KPIs and KRIs will vary from trial to trial—in the example above, KPIs include subject accrual, device performance, and device success. KRIs include protocol deviations, adverse events, and device malfunctions. Using a software program that can extract the data in real time allows for the quickest response when a site trigger is activated. There are some software programs that will also automatically notify site personnel when a trigger is activated. Key personnel for executing the monitoring plan could be assigned to specific task areas.
Technical Resources International provides several services in support of RBM to meet client needs, including data visualizations and analysis of site performance, KPI and KRI selection, remote site monitoring, generating ad hoc reports for dissemination to site personnel, and regulatory compliance consultation. Our off site RBM team uses data visualization software to develop customized dashboards and graphics to track critical KPIs and KRIs throughout the trial, allowing for rapid issue identification and remediation.
Footnote
- U.S. Dept. of Health and Human Services, Food and Drug Administration. (2013). Guidance for Industry: Oversight of Clinical Investigations—A Risk-Based Approach to Monitoring. Retrieved 09/08/2015, from: http://www.fda.gov/downloads/Drugs/.../Guidances/UCM269919.pdf
- Rosenberg, M. (2013). Adaptive Monitoring: Risk-Based Monitoring and Beyond. Journal of Clinical Research Best Practices. 9:9.
About the Author
Dr. Jennie White holds a doctorate in Toxicology and Risk Assessment and serves as project manager and data analyst for TRI’s Bioinformatics team. Dr. White has extensive experience analyzing large clinical-datasets according to client needs as well as performing analyses and data visualization. Please visit www.tech-res.com for more information.

